Exploring data from the 2025 Belgian GP
The 2025 Belgian GP is the first live GP weekend since I started this project. And it's a tricky GP to have as the first one to analyze because it's not a regular F1 weekend: it's Sprint weekend.
To understand what a Sprint weekend is, first we need to look at how a regular F1 weekend is structured:
Regular F1 Weekend Structure
| Session | Duration | Description |
|---|---|---|
| Free Practice 1 | 60 minutes | Practice |
| Free Practice 2 | 60 minutes | Practice |
| Free Practice 3 | 60 minutes | Practice |
| Qualifying | ~60 minutes | Determines the start order grid for the race |
| Race | 320 km (usually ~100 minutes) | The big event |
Sprint
In 2021 F1 introduced sprint races, a concept very common in lower formulae but a novelty in F1 introduced to attract more attention. The sprint race is just a shorter race (1/3 length of a feature race) run on Saturday.
Having another race means having another qualifying session. The total available time in the weekend is the same, which means 2 free practices need to be dropped during these type of weekends to make way for the new events.
Sprint F1 Weekend
| Session | Duration | Description |
|---|---|---|
| Free Practice 1 | 60 minutes | Practice |
| Sprint Qualifying | ~45 minutes | Determines the start grid order for the sprint race |
| Sprint | 1/3 feature race | Sprint race |
| Qualifying | ~60 minutes | Determines the start grid order for the feature race |
| Race | 320 km (usually ~100 minutes) | The big event |
On sprint weekends, teams have only 1 free practice to test what they usually do in 3 practices, which makes this forecasting project even trickier.
In reality, teams use the first half of the only practice to test tyre compounds and then switch focus (usually) to qualifying pace, as the first qualifying session is just a few hours after the practice.
In the sprint race, besides looking into getting more Championship points, teams gather race pace data for the big event on Sunday. This effectively makes the sprint race a sort-of second free practice for teams.
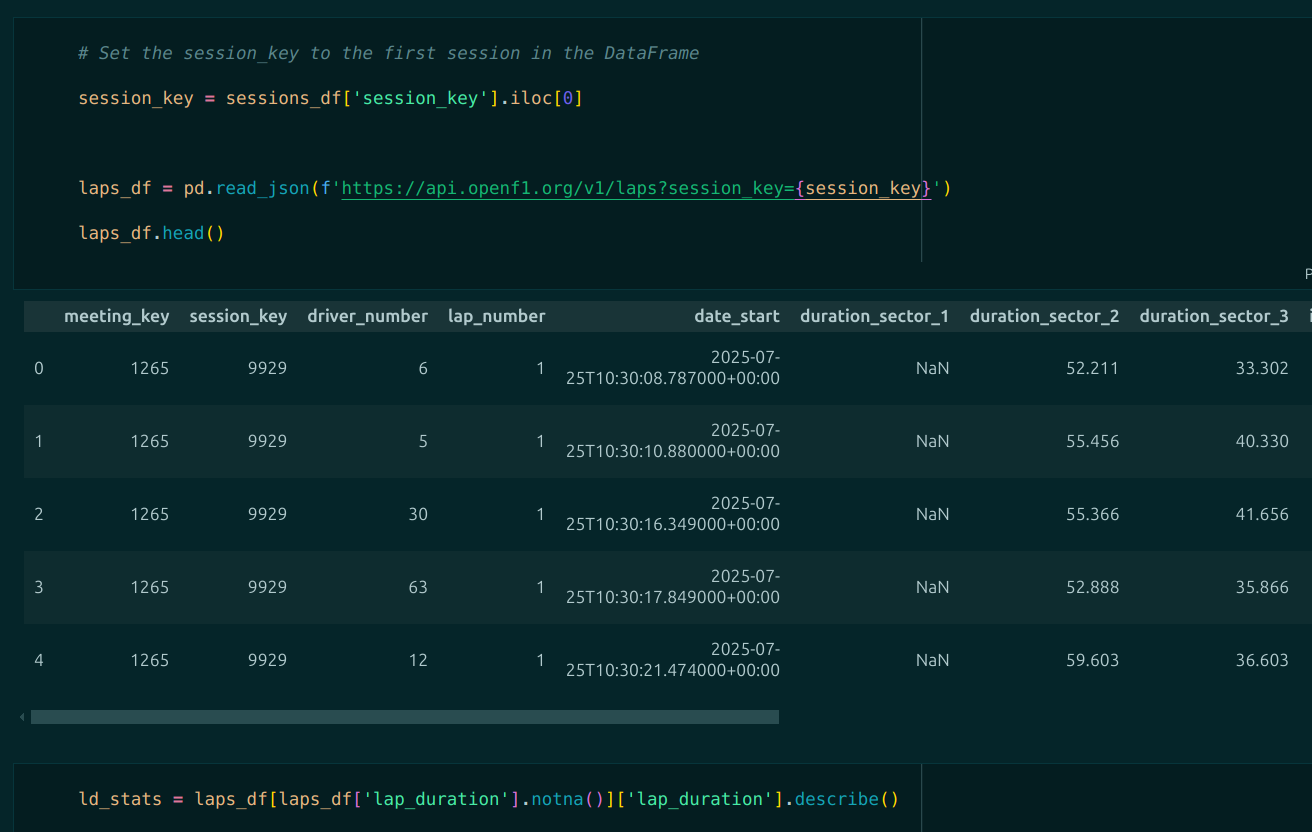
Looking at the free practice 1 (FP1) data
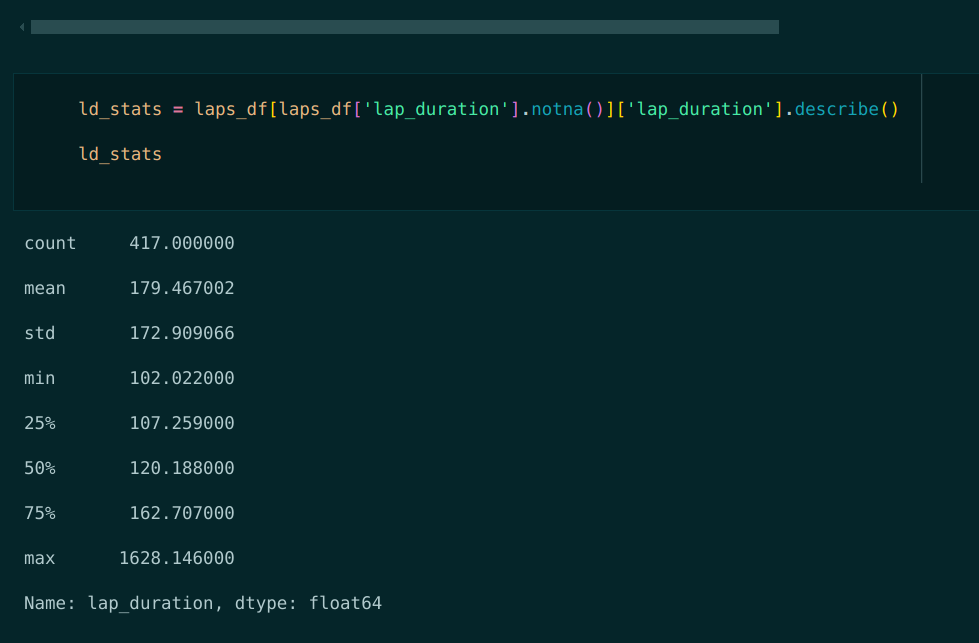
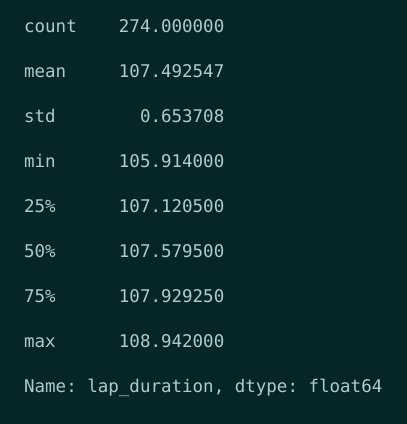
Thoughs after reading these first basic stats
Some of these lap times are not good examples of race lap times, for example we can see: pit out laps, slow laps, errors in the data.
The lap time of 1,628.146 seconds (almost 1/2 hour) is clearly a mismeasurement. There is a required delta time that the drivers must meet, no one can just be driving around completing only 1 lap in 30 minutes (the driver would be flagged for dangerous driving 😅).
Looking at the other quartiles: I can see a lot of non-representative lap times. Let's take the 50th percentile for example: 120 seconds. In F1, the distances between lap times are measured in miliseconds (1000th of a second). It's all about precision. Something like 300ms slower than the fastest lap means being VERY slow. Being 1 second slower than the fastest lap is way beyond very slow; it's a silly amount of time. So, the 120 seconds of the 50th percentile is not a race lap (18 seconds slower than the fastest lap).
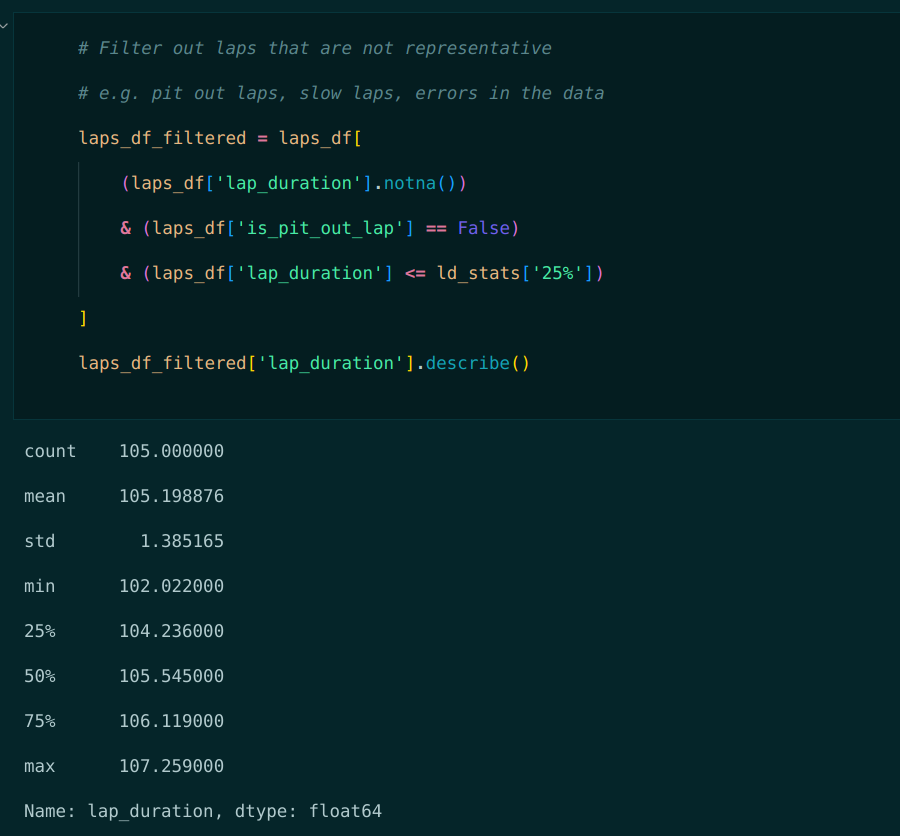
For this reason, going forward I will only consider the lap times in the first quartile for lap time analysis.
Box plot to see lap time quartiles per driver

Observations from the box plot
The X-axis of the boxplot is sorted by the minimum lap time set by each driver: the left most was the fastest in the session and the right-most was the slowest. This is how F1's officially presents the final timetable for the session.
The thing that first caught my eye was driver 63's box: he set the overall 4th fastest lap of the session. However, that lap time was an outlier! It's NOT AT ALL an overall representation of what he did during the session.
The next thing that I noticed is the Y-axis position of the boxes compared to each other. You can see for example that driver 1 was more on a "qualifying mode" than the rest, as his box is positioned towards the lower end of the Y-axis (faster lap times).
Quartiles in tabular form:
I want to see the box plot information in tabular form, and also the number of laps each driver did.

Looking at the sprint race lap data
Enough about FP1, moving on to the sprint race data. I fetched the lap data and started looking at the stats:
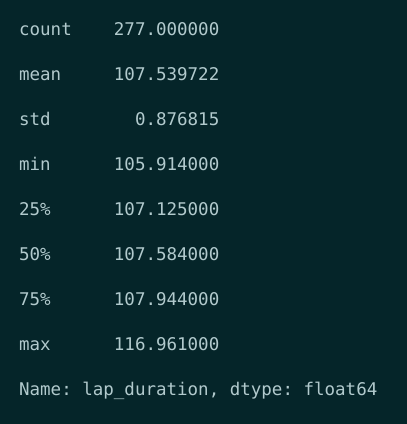
There is [at least] one non-representive lap time because the max lap time is 116.961 seconds. I say is non-representative because there were no pit stops during this race, so there is no "normal" reason why there would be a lap time almost 10 seconds slower than the third quartile.
In reality, driver 10 had car issues, started the race 2 laps after the official start and drove around a few laps before retiring.
To remove this non-representative max lap time, I will filter out the lap data to consider only laps within the 99th percentile.
Sprint race lap time stats per driver
Same as before, I computed the usual stats and the quartiles, and added a column with the difference in Q75 to the first driver.
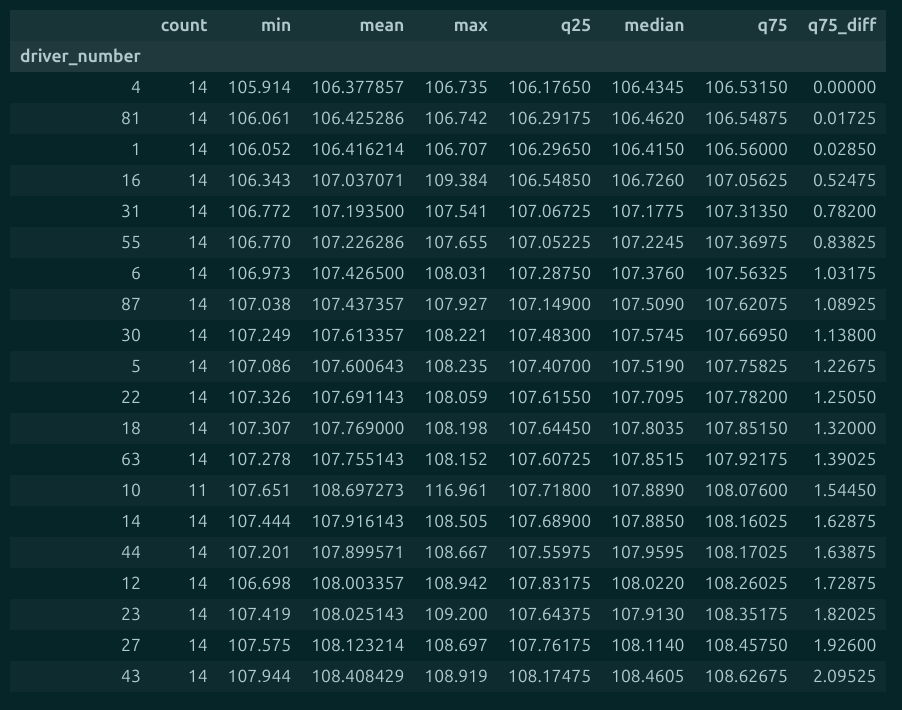
My thoughts on race pace
After taking a look this grid for a while, I decided to focus on the third quartile, as it tells me something about the consistency of the lap times.
There are other factors that I'm not taking into consideration quite yet, like the fact that driver 81 opened the DRS basically on every lap. Remember: I'm just exploring for now to find those elements to pay attention to.
Another thing that is difficult to quantify in this data is the fact that driver 1, who won the sprint race, had a very-low-downforce configuration, meaning that the car was fastest on straights. This was a decision the team made since the sprint race was just 15 laps (driver 1 had to endure difficulty to handle the car in the corners for just 15 laps, not as long as a full race). This is something you can visually see when watching the live stream and it can also be inferred by the straight-line speed the car had. But it's not available in public data.
When the time comes to try to make a prediction, I have to "manually" take this input into consideration.
Post-race feedback
The day after the race I went to my notebook to try correlate my findings above with the actual race result.
Silver linings
- Based on the difference in Q75 lap times in the sprint race, I thought that driver 16 was 0.5 seconds per lap behind the top-3 (drivers 4, 81 and 1) which would translate into a 20-second difference at the end of race after 40 laps. Guess what? it was right! Driver 16 finished the race 20.185 seconds behind!
- Driver 63 started behind driver 23 but, based on the sprint data, the race pace of 63 was better and he would overtake 23 during the race. This was also correct, as it happened exactly in the race.
Caveats
- Apart from being a sprint weekend, this GP was particularly a tough one to analyze because it also rained (a lot) right before the race. On rain, drivers cannot go fast because they would slide in the wet surface and crash. So, everyone has more or less the same pace and any prediction made based on dry conditions has to be discarded.
- Driver 1 made a significant change in downforce configuration for the feature race, making his sprint race data basically irrelevant.
To the next race
Let's see what the next race has for us in the Hungarian Grand Prix next weekend!